People get tired of reading words all the time, and your website’s or blog’s readers are no different. Luckily, you can reignite reader interest in your content by presenting it in different formats, including those that are visual in nature. Currently, one of the most popular methods for doing so is through the infographic.
- Inbox Dollars - Get paid to check your email. $5 bonus just for signing up!
- Survey Junkie - The #1 survey site that doesn't suck. Short surveys, high payouts, simply the best.
- Nielsen - Download their app and get paid $50!
The ideal infographic contains just the right mix of appealing visuals and significant data, plus a smattering of humor or wit to break up all the statistics and reporting.
Finally, the infographic should be equipped with a tracking code that credits the source, such as a website or the blogger (i.e., you).
However, unless you are well-versed in Photoshop, it is challenging to quickly and easily represent information in a graphic manner. As a result, many webmasters and bloggers have shied away from generating infographics. Likewise, many webmasters have the needed skills, but they don’t have the time to be sifting through esoteric information sources for statistical data sets.
Luckily, there are many free or free trial tools out there that enable anyone to become a master of infographic design. Likewise, there are many data aggregator sites that present information on one handy platform.
As a result, you can now create all kinds of eye-catching infographics that will amaze your readers and bring traffic to your website or blog. Here are some of the best design tools that will quickly move you towards professional-looking infographics.
7 free online tools that help you create amazing infographics
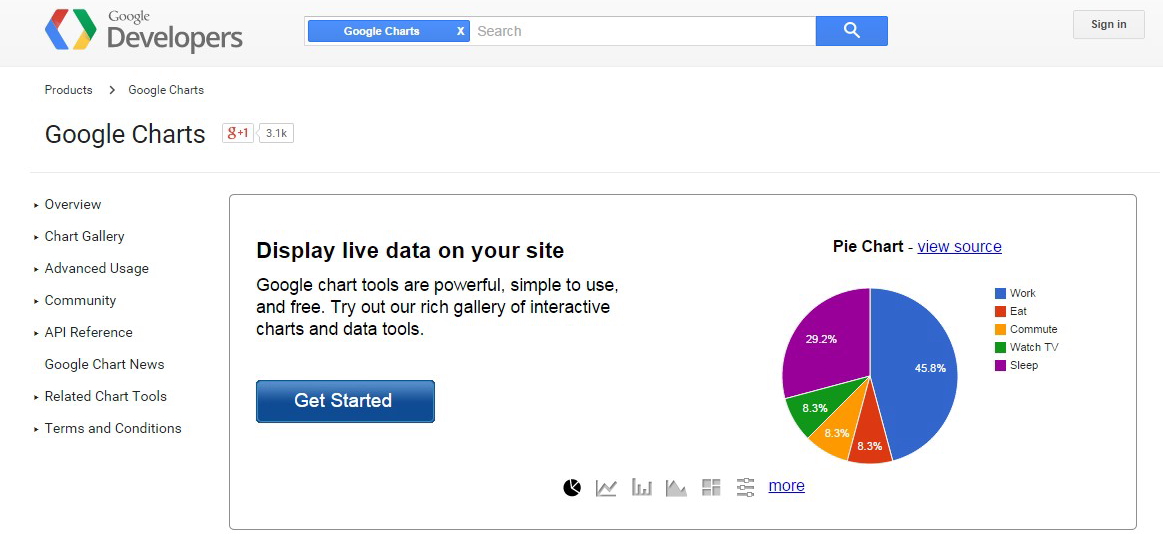
1. Google Charts
To create pie charts, graphs and tree maps, look no further than Google Charts, a free tool offered in the Google Developers area. This tool also enables you to display your data in real-time and with animations.
2. Venngage
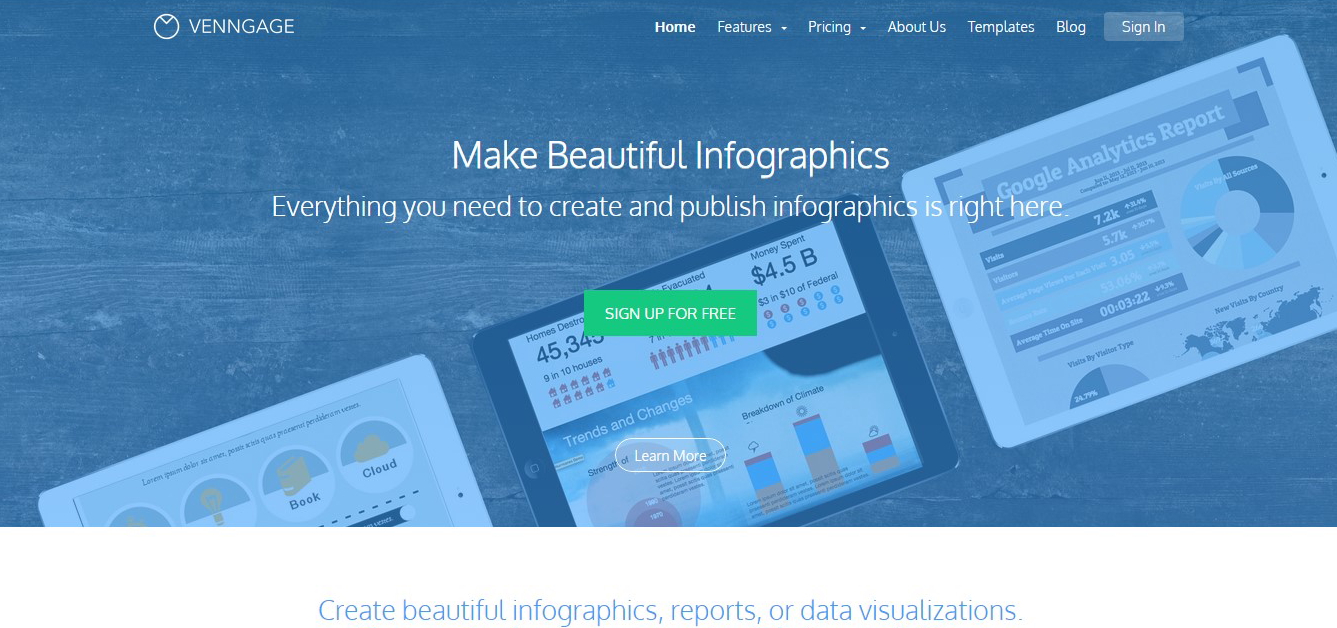
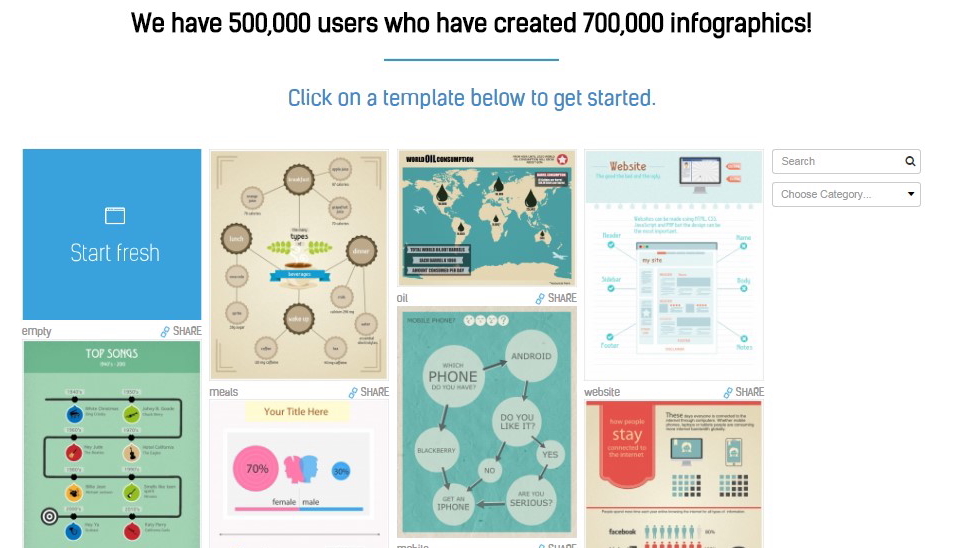
This site offers a free version of its infographics-generating software that includes several themes, templates, charts, icons and even ready-to-go infographics.
3. Easel.ly
This tool provides you with templates that you can customize with your own data, images, etc. If you need extra images or items like arrows, shapes, etc., they are available too.
4. Piktochart
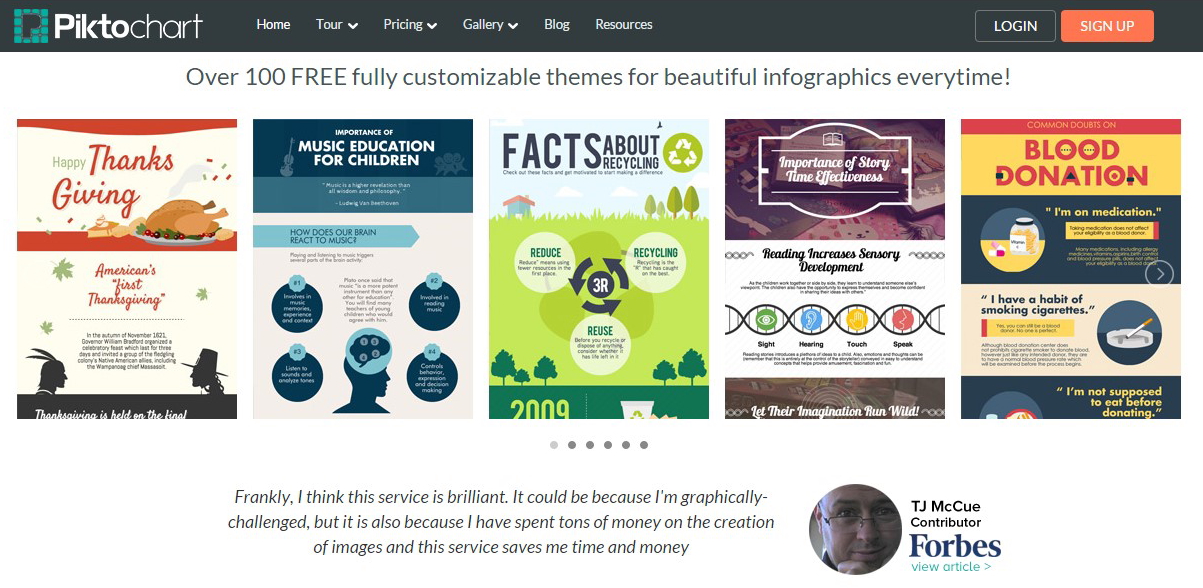
Here, you get three free themes that you can customize with your own color palette, fonts, shapes, graphics and images. You can also add your own images. Infographics generated with Piktochart can integrate with Slideshare and Evernote.
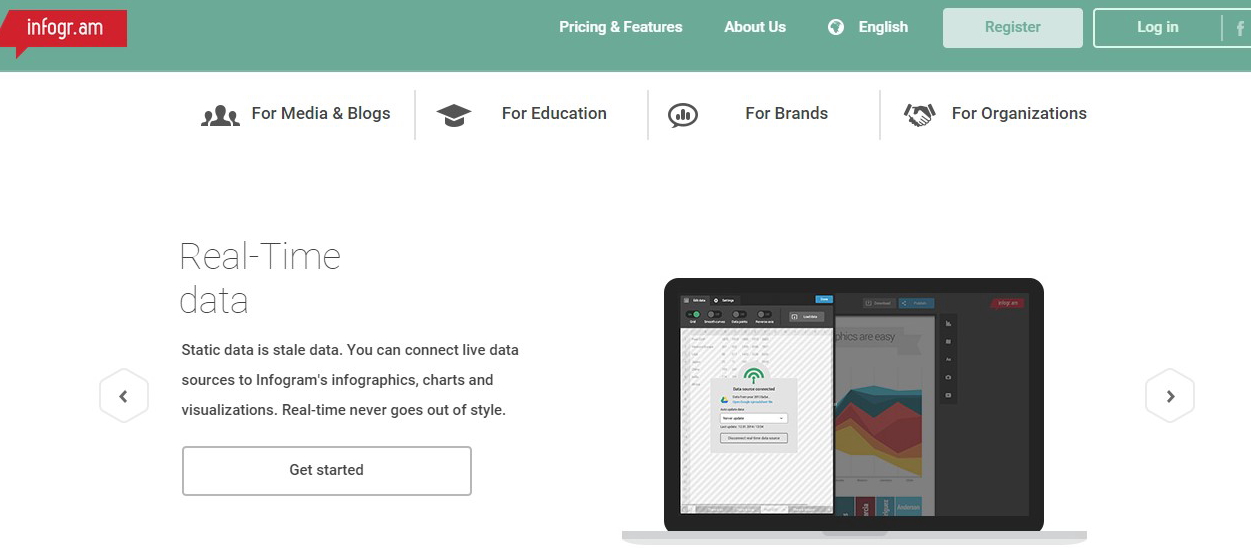
5. Infogr.am
This tool provides lots of great graphs, info maps and charts for free that you can customize via the site’s custom Excel spreadsheet. You can also add your own photos and videos. Infographics generated through this site can also be made mobile-responsive.
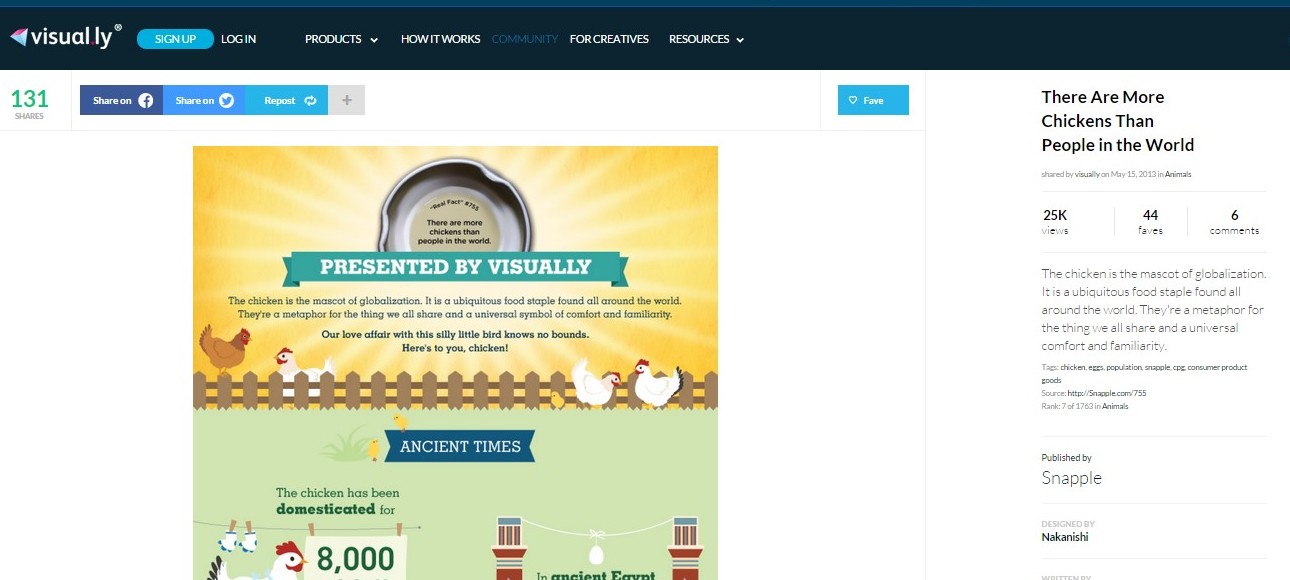
6. Visual.ly
Here, you not only get to create infographics for free, but you can also earn money. Visual.ly connects prospective brands and clients with talented infographics designers looking for work. So, if you want to earn money for your infographic-making skills, be sure to post your current work on this site once you’ve completed it, thus creating your own work portfolio.
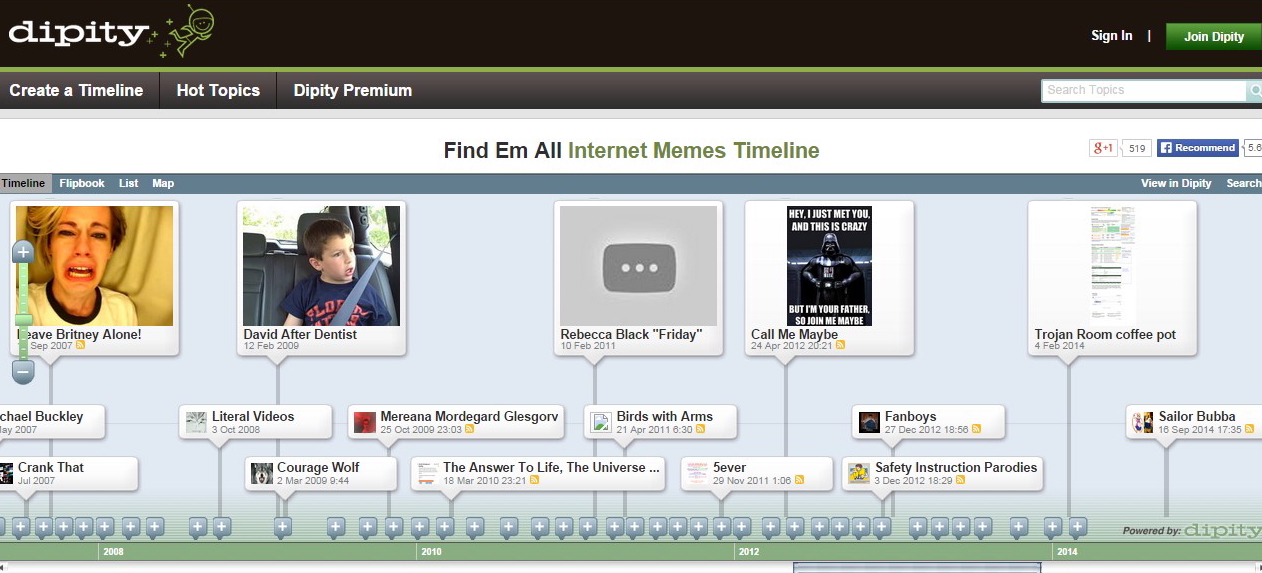
7. Dipity
With this tool, you can generate infographics that include video and/or audio, provide location or time info, and which integrate with social media platforms to boot. Dipity’s paid version even offers infographic analytics and iPhone apps.
Finding reliable data sources
Infographics are only as good as the data they showcase. To find the best data without spending endless hours online or in the library, you should visit the following sites:
AIP– The American Institute of Physics publishes studies on employment, pay rates, undergraduate enrollment, etc. in physics and several applied science fields.
CMS.gov– The Centers for Medicare and Medicaid Services publishes information on its policies, medical and psychiatric health outcomes, insurance providers, and the like.
No joke. Here are the fastest ways to make easy money online. Click here to see how.
Data.gov– From agriculture to finance to science and technology, there is all kinds of good, U.S.-based information at this site.
Data Market– This is a good place for finding information on the national economy and healthcare, agriculture and the automotive industry.
FactBrowser– Looking for marketing stats or consumer behavior information? Then look no further than FactBrowser, a site that compiles all manner of data on the latest online technologies and e-commerce trends. Some of this information is even provided as infographics, case studies or forecasts.
Google Public Data– This site publishes some rather large data sets derived from sources such as the U.S. Bureau of Labor Statistics, World Bank, World Health Organization, U.S. Census Bureau, etc.
Google Scholar– Use this specialized tool to search on academic information including journal publications, dissertations and theses, as well as research reports published by government agencies and national laboratories.
UNICEF and WHO– World health statistics such as infant mortality rates and HIV infection stats are reported here. Social work and justice statistics are also big foci.
WorldBank– This site provides financial data from all over the world, including national GNPs, debt ratios, etc.
Wunderground– This site provides historical weather information segmented by city or zip code.
Finally…
An infographic must not only be useful, but also pretty. In other words, don’t go stuffing your graphic with endless reams of information, thus making it bore the viewer. Also, viewers do want to see verifiable information, so list your sources at the bottom of the infographic and attribute all direct quotes.
If you don’t find the information you are looking for, consider doing your own research study using a tool like SurveyMonkey and reporting the collected data. You can also survey your email subscribers using a survey tool like MailChimp.
Do you have a data reporting tool or infographics generator that you prefer? Let us know in the comments below.


Hi Halina,
Thanks for sharing such great resources! Have always been paying some graphic designer to do it – of course at a hefty price!!